Introduction
As we envision a future with better mobility in Metro Manila and beyond, it's essential to understand the current state of public transportation. It is crucial to have access to reliable, authoritative, and substantiated data to make informed decisions and develop innovative solutions.
By highlighting key data sources and active initiatives on public transportation in Metro Manila and the Philippines, we hope to facilitate a broad understanding of the present situation, and give ideas on where to look for a deeper dive.
Whether you're a student working on a research project or an individual passionate about improving mobility as it impacts society, we hope the information presented in this post will serve as a stepping stone for your journey. As we explore various data sources and learn more about the mobility landscape, let's work together to imagine a better world and set ambitious targets for the future of mobility in the nation.
Overview of Public Transportation Systems
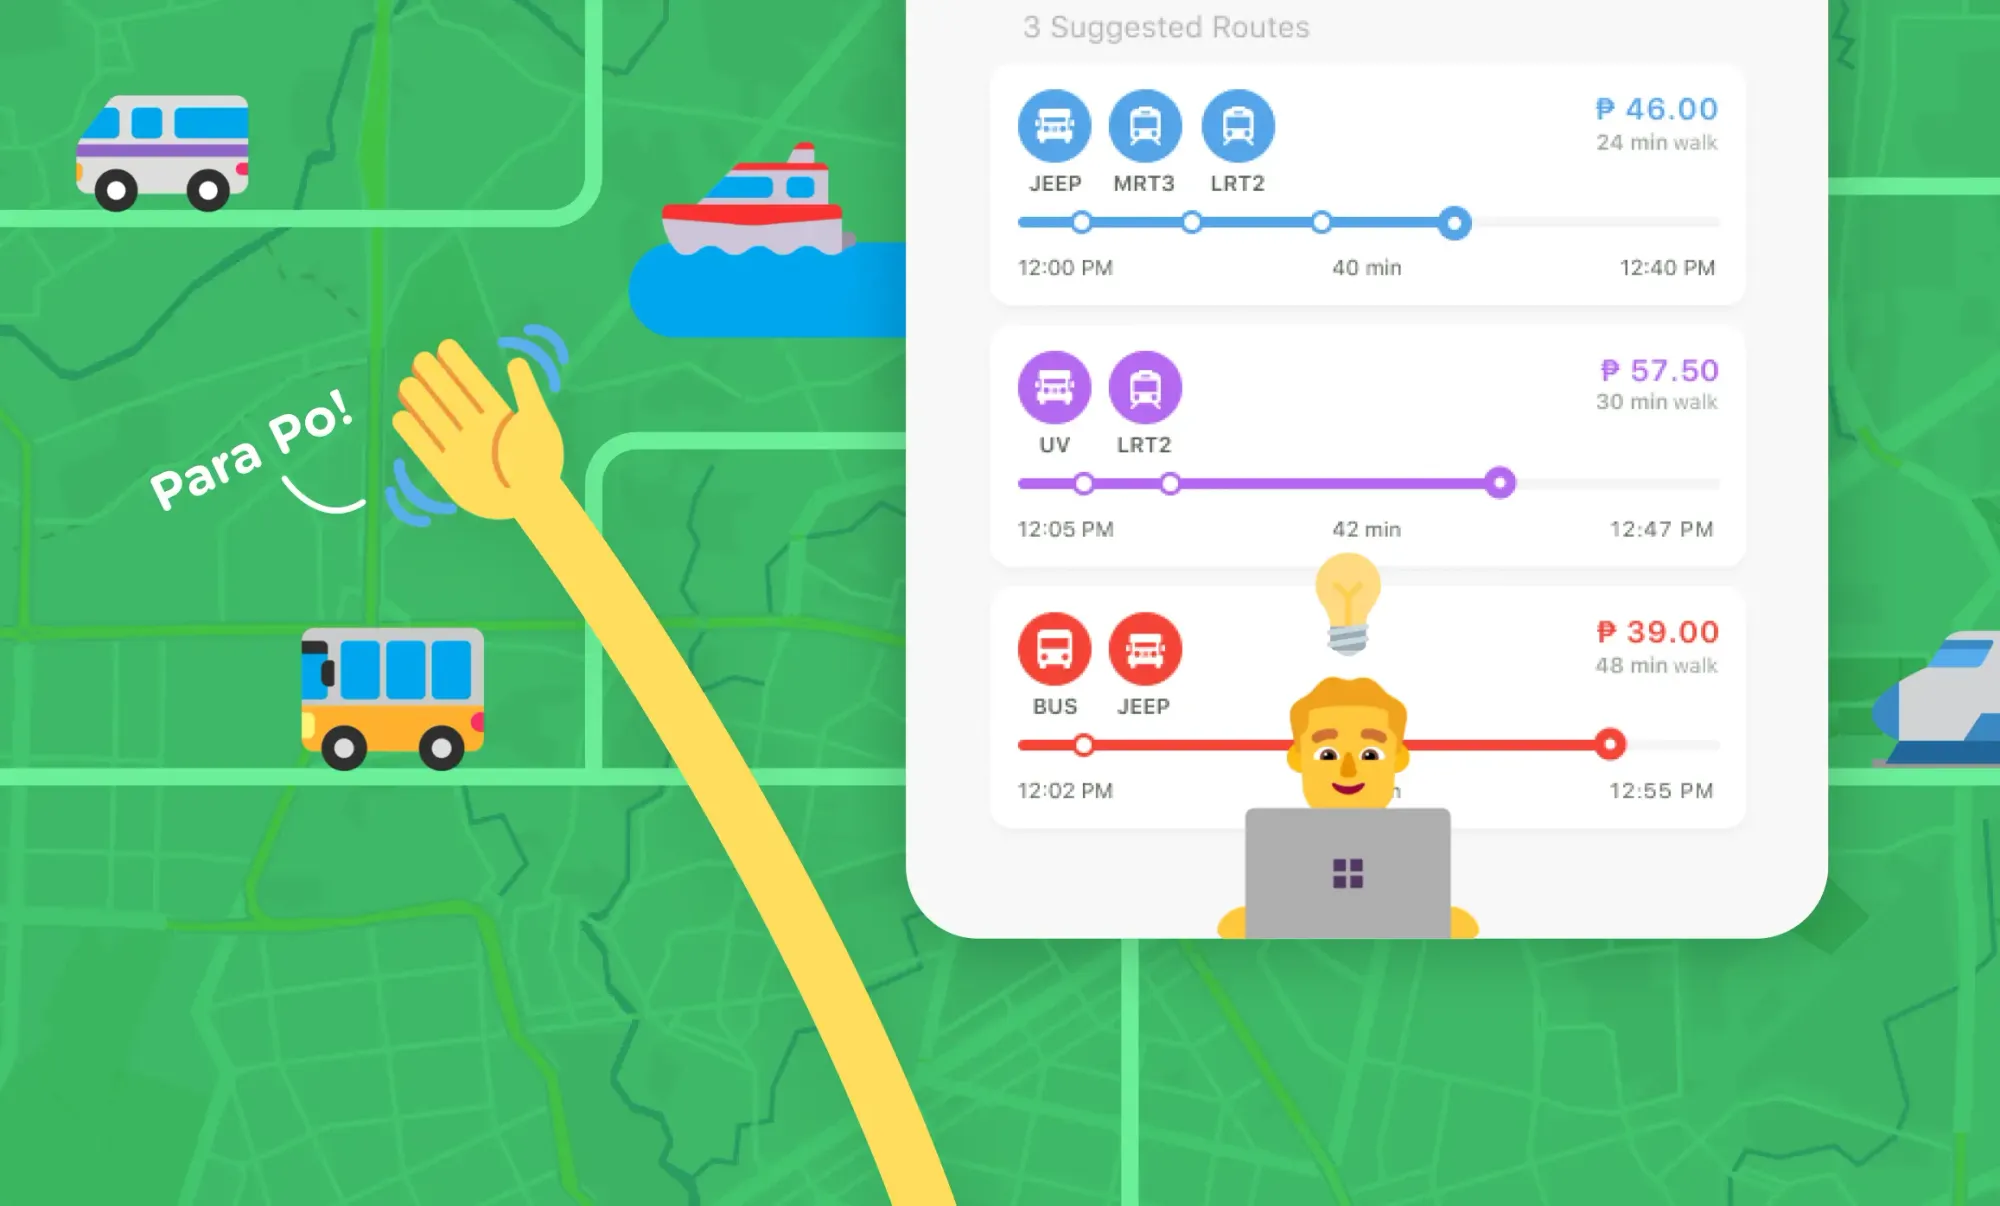
When we think of public transportation, the most visible examples come to mind: colorful jeepneys and packed trains, with some ferries added to the mix. We can start by splitting this into Rail, Road, and Maritime.
Rail
We can start with a simple question: how many people rode the LRT1, LRT-2, MRT-3, and PNR in 2022? For this sort of question, the Freedom of Information Portal is a big enabler - we can request public data directly from the government, and see previous requests, as well.
LRT-1 and LRT-2 Ridership
Thanks to this eFOI Request from March 2023, the government has shared entry traffic data for 2022 monthly ridership:
- the LRT-1 recorded 78,458,605 passengers over 357 days of operation, and
- the LRT-2 recorded 31,639,345 passengers over 360 days of operation
The Philippine Statistics Authority also manages the Quickstat, an index of the most frequently-requested statistics. This is available on both the national and regional level. From the March 2023 Quickstat, the LRT-2’s monthly ridership is given as follows:
- Nov 2021: 1.29 million
- Oct 2022: 3.65 million
- Nov 2022: 3.72 million
MRT-3 Ridership
For the MRT-3, eFOI requests for ridership are typically successful, though the data is sent directly to the requesting party, rather than published on the portal itself. The official MRT-3 Facebook pages do occasionally provide numbers on daily ridership:
- February 8, 2023: 403,128 (source post)
- February 14, 2023: 408,259 (source post)
The government’s own official newswire, the Philippine News Agency, cites this as the source for their own reporting.
Inquirer.net cites the the Department of Transportation and MRT-3 General Manager Engr. Federico J. Canar in a January 2023 article stating annual ridership:
- 2022: 98,330,683
- 2021: 35,691,914
- 2020: 31,887,174
The same article gives monthly ridership numbers:
- Oct 2022: 8,996,743
- Nov 2022: 8,939,743
- Dec 2022: 9,302,645
The Manila Bulletin has its own published article on these numbers.
Philippine National Railway Ridership
For the PNR, we again benefit from the eFOI Portal, from a request made in January 2023. This gives us the average daily ridership in 2022 for the different PNR lines:
- Metro North Commuter (MNC) running G. Pascual-Bicutan: 2,612
- Metro South Commuter (MSC) running Tutuban-Calamba: 18.387
- Inter Provincial Commuter running Calamba-Lucena: 1,368
- Bicol Commuter running Sipocot-Naga: 1,360
Across all the routes, the average daily ridership is 23,727.
Road
Road-based transport is a diverse mix: we have jeepneys, UV Expresses, buses handling longer routes, while tricycles frequently handle trips inside smaller areas.
According to a report by the Philippine Star, citing the LTFRB, there are about 158,000 traditional jeepneys plying routes across the country. A CNN report puts modern jeepneys at 6,814 units and UV Express at 19,000 units nationwide.
Citing LTO, LTFRB, and DOTr numbers, the “Jeepney+ NAMA” report by Changing Transport (2016) from 2016 (published by DOTr and GiZ) provides the following estimates for road transport inside Metro Manila:
- Buses: 9,669 units
- Jeepneys: 54,843 units
- AUVs (UV Express): 5,953 units
This makes up a fraction of all the registered motor vehicles in NCR as of August 2019: a Rappler report citing August 2019 numbers puts this at 1,644,932 motor vehicles in NCR, and 880,168 in Region IV-A.
On October 24 2022, the EDSA Carousel reached an all-time high, reaching peak daily ridership at 404,010 passengers, as captured by the Manila Bulletin. A report from December 2022 by the Philippine Information Agency put the average daily ridership at 389,579.
Sakay has a listing of stops, fares, and service guidelines on our EDSA Carousel Guide.
Maritime
Commuters can ride the Pasig River Ferry for free as of 2023. Data on ridership is published by the MMDA. According to reports by the Philippine Star and Manila Bulletin:
- 2020: 33,674 passengers for the year
- 2021: 58,784 passengers for the year
- 2022: 149,167 passengers from January to November
For monthly ridership, the MMDA also highlighted September 2022 to be its peak at 16,226 passengers for that month.
Sakay has collected schedule information, service guidelines, and qualitative observations in our Pasig Ferry Guide.
Coverage and Distribution
It is one thing to consider the number of vehicles that make up our mobility network; we also need to consider whether where they are, especially as we ease pandemic restrictions.
The 2016 Jeepney+ NAMA Report cites research by J. B. Biona (Clean Air Asia on behalf of GIZ) in 2015 that maps these out.
Sakay conducted an accessibility analysis in April 2020, which looked into how far a commuter might have to walk to reach somewhere they would be able to take public transit.
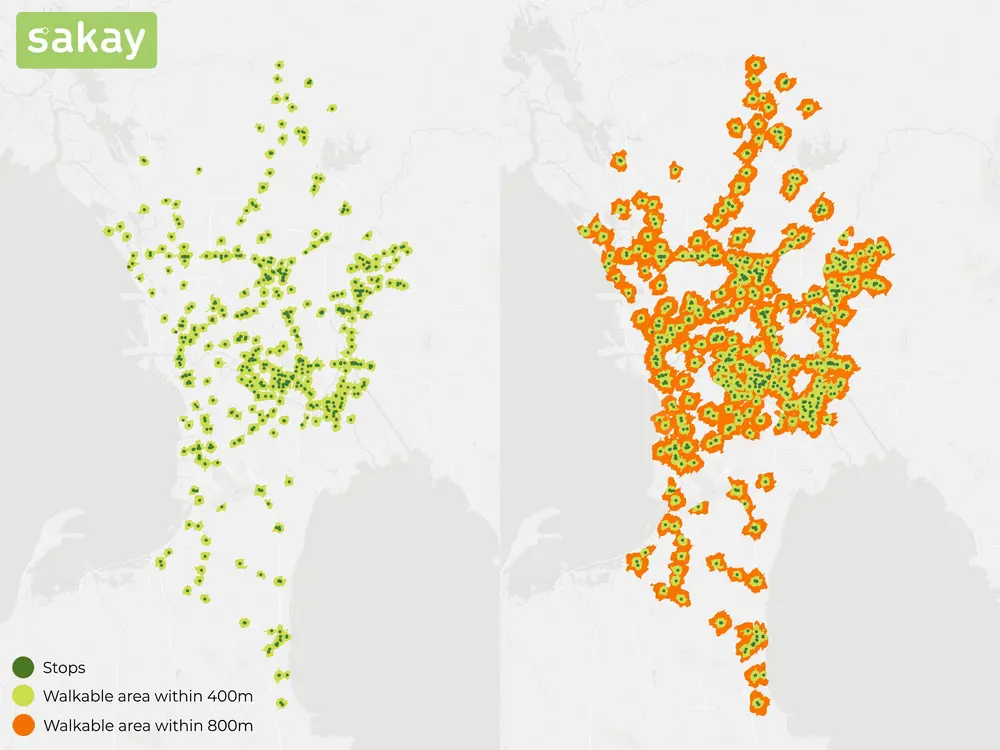
In December 2020, we also published a Mega Manila review that compared the pre- and post-ECQ transit network, according to Sakay’s own data.
Move People, Not Cars
Population
Focusing on people gives us necessary context for understanding mobility needs. How many people live in Metro Manila?
According to the February 2023 Quickstat, which cites the 2020 and 2010 Censuses of Population and Housing, Metro Manila has a population of 13,484,462 - but that’s just how many people live there (also called the nighttime population).
This count excludes people who live out of the area and travel there, also called the daytime population or commuter-adjusted population. According to a 2018 study by Dr. Emma Porio of the Ateneo de Manila University for the same year, this swells to a daytime population of 16–18 million.
How many people live in the surrounding provinces? An August 2019 Follow-Up Survey on Roadmap for Transport Infrastructure Development for Greater Capital Region (GCR) by JICA gives these combined populations:
- NCR and the provinces of Bulacan, Rizal, Laguna, Cavite: 25.8 million
- NCR and surrounding regions (Region III and Region IV): 38.5 million which is 38% of the Philippine population
Means of Mobility
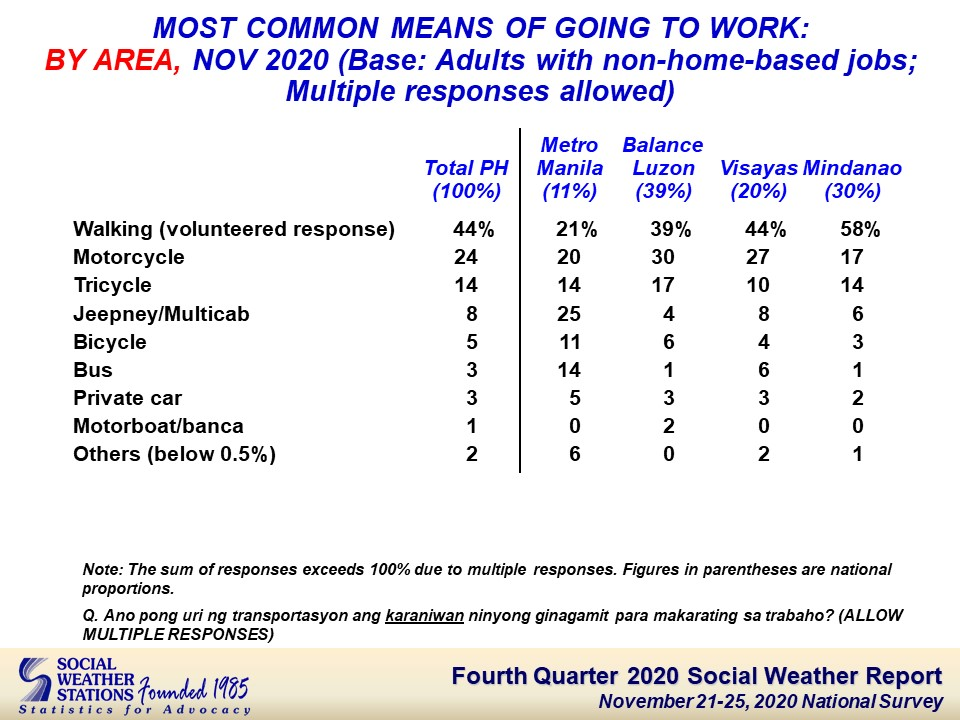
How do people typically travel? Surveys by the Social Weather Stations (SWS) contain a wealth of information. In their nationwide Fourth Quarter 2020 Social Weather Report, the SWS found that the most common forms of mobility within Metro Manila are as follows:
- jeepney/multicab (25%)
- walking (21%)
- motorcycle (20%)
- tricycle (14%)
- bus (14%)
Notably, only 5% of the Metro Manila population typically travels to work by private car.
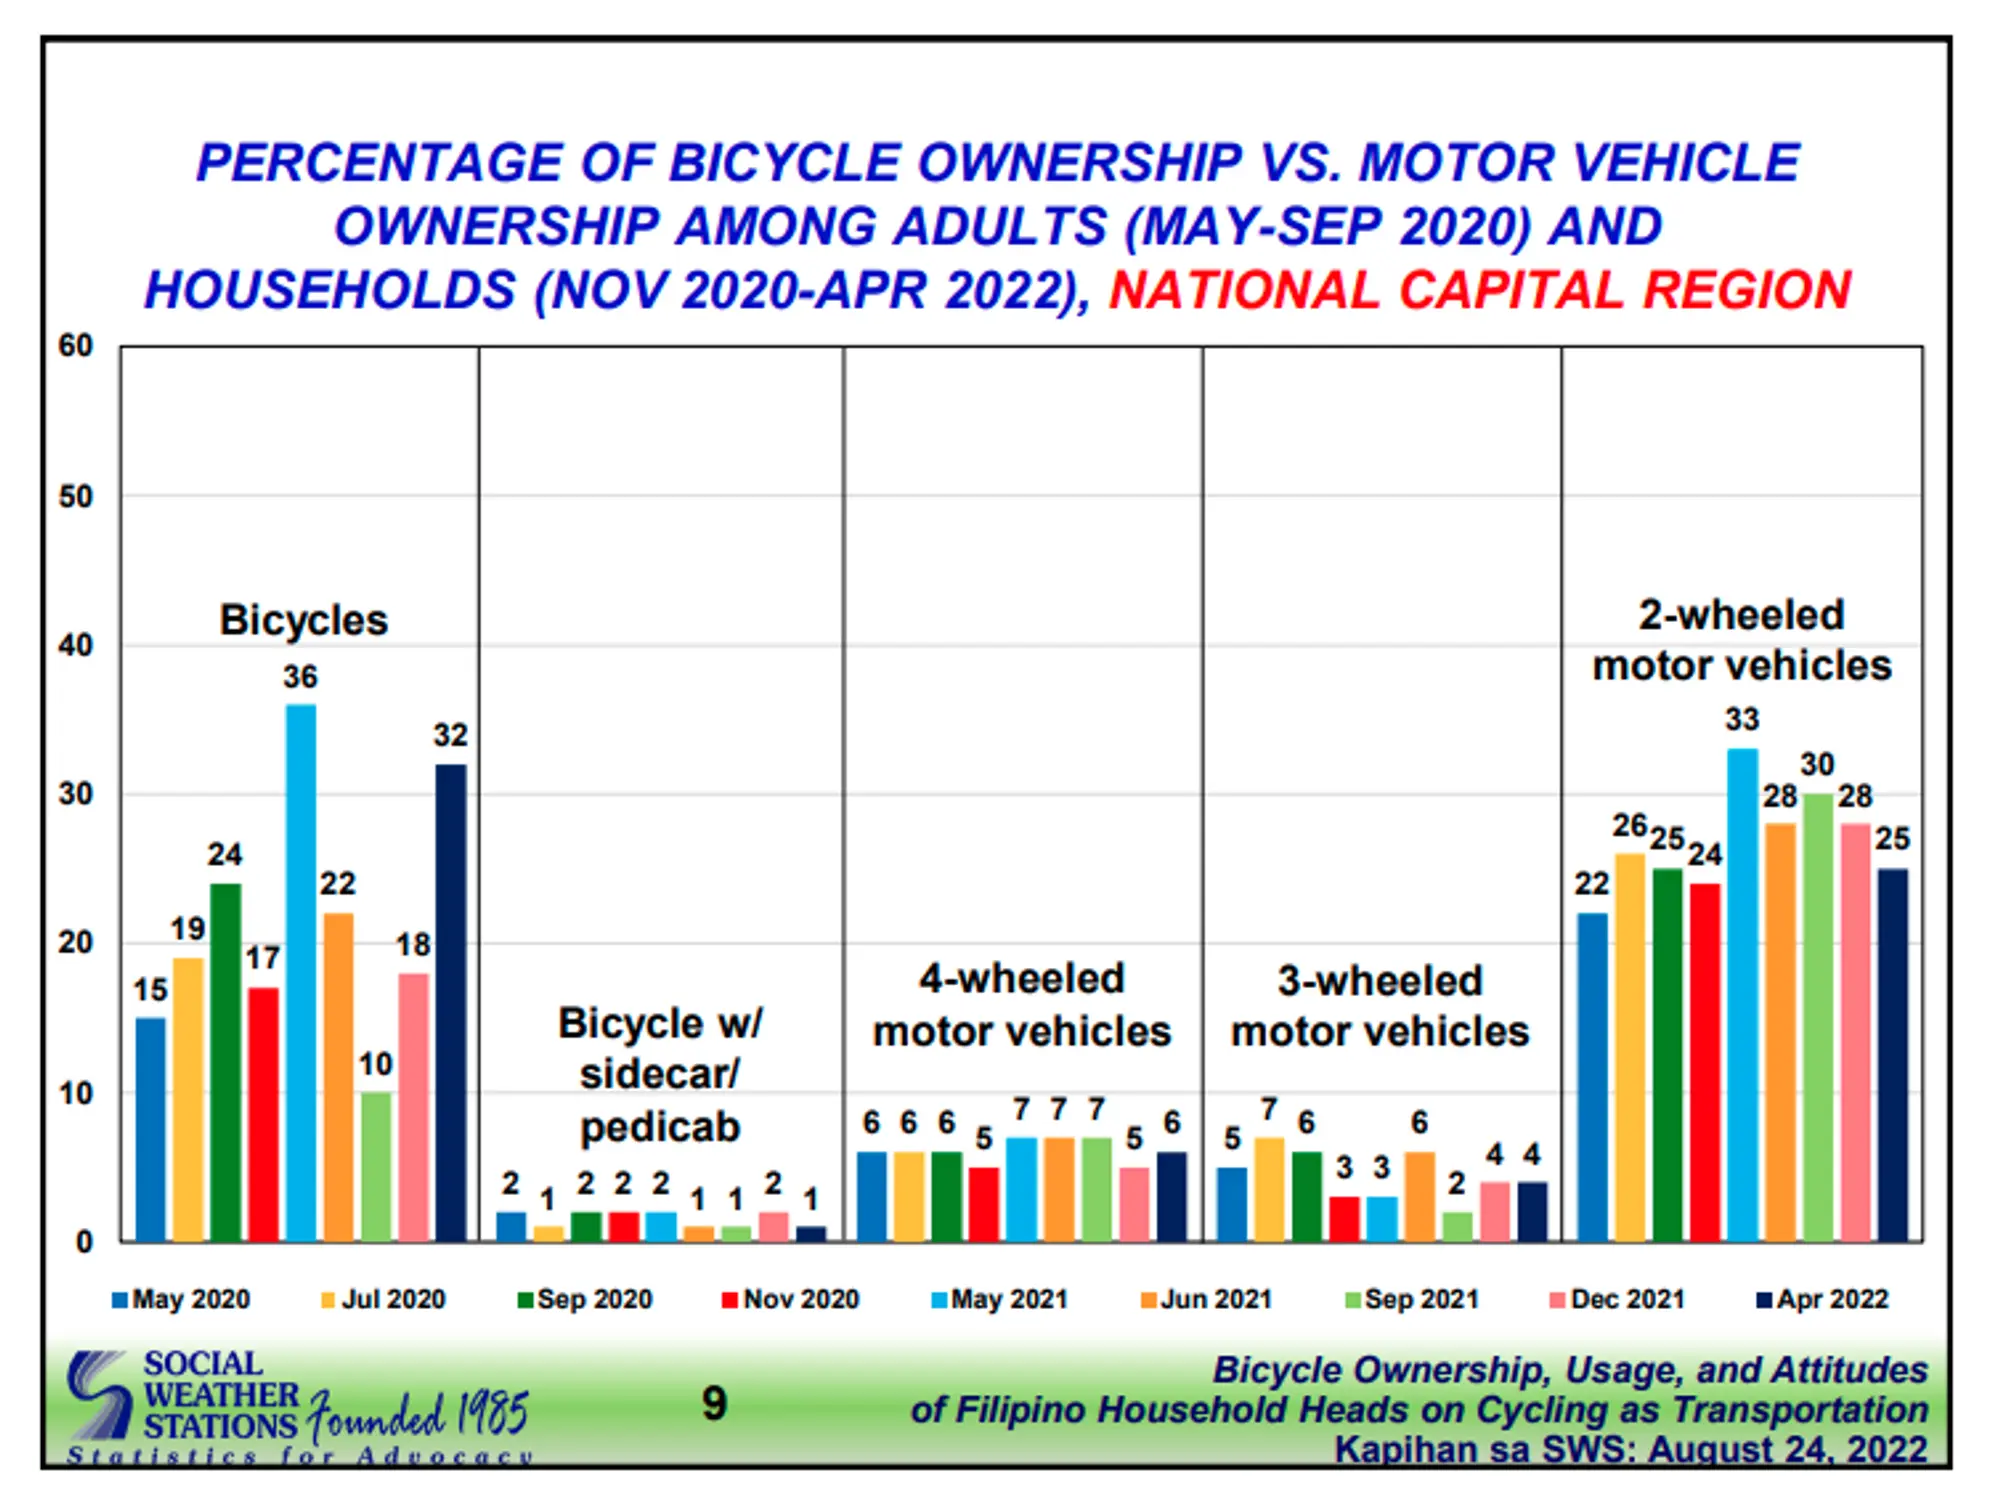
It also matters what options people have, compared to what they take. In Bicycle Ownership, Usage, and Attitudes of Filipino Household Heads on Cycling as Transportation (2022), SWS have also published data on bicycle and motor vehicle ownership across 2020 to 2022, which shows the that bicycles are present in 32% of households, and 2-wheeled motor vehicles (e.g. motorcycles) are present in 25% of households, for the National Capital Region.
Another finding from the Fourth Quarter 2020 Social Weather Report shows that there is strong sentiment across the country for improving support for public transportation, bicycles, and pedestrians over private vehicles.
Moving Forward Together
MMUTIS and MUCEP (2015) are key projects by the Philippine government, with the previous Department of Transportation and Communications in cooperation with JICA, to envision a framework for national transportation planning, as well as surrounding capacities.
Meanwhile, the Philippine Urban Mobility Programme (PUMP) (2020) facilitated by Changing Transport and GiZ focuses on laying out a framework for Highly Urbanized Cities (HUCs) and urban Local Government Units (LGUs) to improve mobility within their areas, including efforts for modernization, and steps to tackle barriers to non-motorized or active transport.
A report by the Philippine Information Authority notes that as of January 2023, the Department of Transportation has laid out initiatives for its Active Transport Infrastructure Program. This is in accordance with the Philippine Development Plan 2023-2028, under which pedestrians and cyclists will be accorded highest priority in the hierarchy of road users.
Conclusion
The questions above just skim the surface of the world of mobility, but taken together paint a picture of what the landscape is like in 2023. There are a lot sources of information available who have proven and reliable methodologies, and themselves can introduce you to even more interesting studies — take a look, click around, and don’t be afraid to reach out!
Research for the sources conducted by the Sakay data team; parts of this post were co-written with AI.
